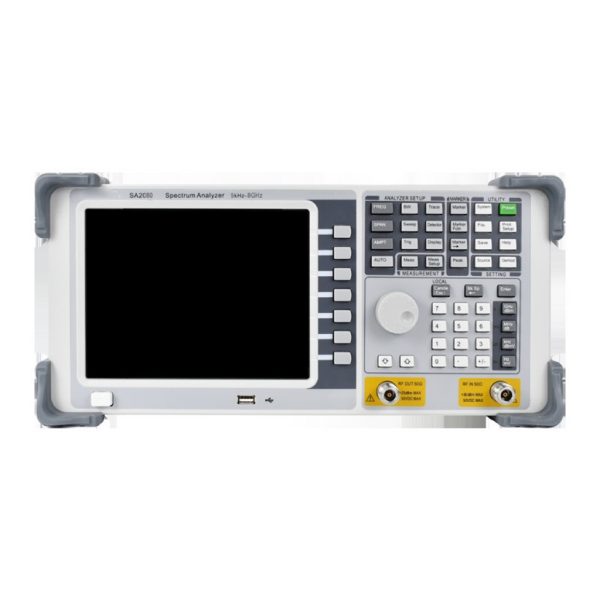
SA2080 Spectrum Analyzer Frequency range:5kHz∼8GHz
$13810
The SA2080 spectrum analyzer is a wide band,
high-performance microwave spectrum analyzer that measures
frequency range from 5kHz to 8GHz. The
product uses an all-aluminum chassis, an 8.4-inch high-brightness
display screen, and has a excellent environmental adaptability.
Highly integrated RF front-end and digital IF technology ensure its
outstanding and stable performance. The maximum real-time
bandwidth of 40MHz meets the testing of commonly used radio
signals such as mobile communications, TV, and WiFi. The
145MHz analog IF output provides users with a variety of test
options. The product has a variety of intelligent measurement
functions such as spectrum analysis, field strength measurement,
channel scanning, third-order inter modulation, harmonic
distortion, signal-to-noise ratio, and Pass-Fail, and can be widely
used in aerospace, microwave communications, satellite
navigation, radar detection, electronic detection and confrontation,
precision guidance and other fields.
- Description
Description
|
Spectrum Analyzer |
|
|
SA2080 Spectrum Analyzer |
|
|
SA2080 |
|
|
The SA2080 spectrum analyzer is a wide band, |
|
|
Property |
Value |
|
Frequency Range |
5kHz∼8GHz |
|
Amplitude Accuracy |
1MHz∼13.5GHz,±1.5dB |
|
Phase Noise(@10kHz,f=2GHz) |
SA2080:≤-98dBc/Hz(@10kHz,f=1GHz) |
|
Noise Level |
<-160dBm |
|
Model Type |
Benchtop |
|
Power |
AC |
|
Dimensions |
WR-51 |
|
Features |
|
|
Image frequency /IF rejection:80dB Spectrogram、 CHP、 ACPR、 OBW、 CNR、 TOI、 HD、 |
|
|
Frequency counter、Audio Demo、Pass-Fail etc Advanced measurement |
|
|
All metal chassis,Super strong shielding performance and EMC |
|
|
Applications |
|
|
It can be widely used in various fields such as communication, radio and television broadcasting, radio management, electronic detection and countermeasures, precision guidance, and is also the best choice for university teaching. |
|
|
|
|
|
|
|
Adjacent Channel Power Measurement
Measures Main Channel Power, Power of the Two AdjacentChannels Before and After, and Their Power Difference Relativeto the Main Channel
Audio demodulation and radio monitoring
The graph illustrates the demodulated modulation signal from anAM modulated signal.
Channel Power Measurement
Measurement of Power and Power Density within a SpecifiedChannel Bandwidth
Efficient Ul
Clear and bright trace lines, easy operation.
Frequency Counting Measuremen
Enhanced Accuracy for the Test Signal’s Frequency Accuracy
Harmonic Distortion Measurement
Measures the power of each harmonic of the carrier signal and thetotal harmonic distortion.
Multiple Markers Measurement
Setting up to five frequency markers concurrently, and each markercan be defined in either a normal or delta mode.
NdB Bandwidth Measurement
Utilize this feature for rapid measurement of signal bandwidthBy setting the dB difference from peak power (NdB), it providesreal-time bandwidth at that point.
Occupied Bandwidth Measurement
Integrates Power over the Entire Scan Width and Calculates theBandwidth Occupied by the Specified Power Ratio Based on theSet Power Ratio
Pass-Fail Test
Verifies Whether the Tested Signal is Located Within the Set Windowor Area
Spectrum and Spectrogram
Spectrogram provides a three-dimensional perspective where timeis represented through either depth or color coding, which makesit particularly effective for observingtemporal changes in frequency content.
Third-order Intermodulation Measurement
Measures Parameters of the Third-order Intermodulation Productof Two Signals (with Equal Amplitudes and Close Frequencies)


